当我们做了转录组测序,基因中有上调也有下调基因,画热图的时候如何将up or down区分开?且看接下来的小技巧。
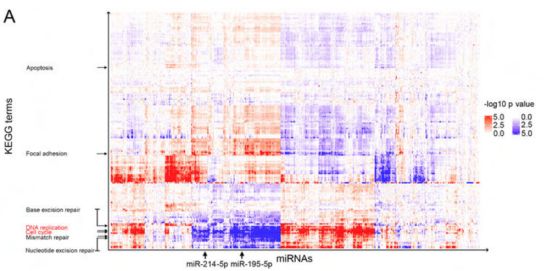
【Hydbring P et al.Cell-Cycle-Targeting MicroRNAs as Therapeutic Tools against Refractory Cancers.Cancer Cell,2017.】
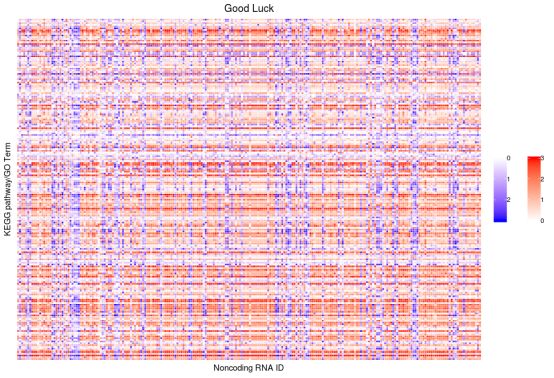
本篇,我们要解决的问题是:热图中如何将不同类别用不同的渐变色表示,如上图所示。接下来,举个例子,若做每个microRNA与Description的热图,颜色渐变是-log10Pvalue,regulated是up的用红色进行渐变,down的用蓝色进行渐变。图例做成如下图所示的样子。

#数据处理:
library(scales)
library(plyr)
library(reshape2)
d<-read.csv(“test.data”,header=T,sep=“\t”,check.names=F,row.names=2)
row<-nrow(d)
if(row<3){?q()?}
data<-d[,-1]
pvalue<-data[,c(grep(“_pvalue”,colnames(data)))]
regulate<-data[,c(grep(“_regulated”,colnames(data)))]
col_name1<-gsub(“_pvalue”,“”,colnames(pvalue))
col_name2<-gsub(“_regulated”,“”,colnames(regulate))
colnames(pvalue)<-col_name1
colnames(regulate)<-col_name2
pvalue.m<-melt(as.matrix(pvalue))
regulate.m<-melt(as.matrix(regulate))
colnames(pvalue.m)<-c(“Pathway”,“ID”,“Pvalue”)
colnames(regulate.m)<-c(“Pathway”,“ID”,“Regulate”)
good<-merge(pvalue.m,regulate.m,by=c(“Pathway”,“ID”))
goods<-ddply(good,?.(Pvalue),?transform,?log10P?=?-log10(Pvalue))
m1<-goods[goods$Regulate==“up”,]
m2<-goods[goods$Regulate==“down”,]
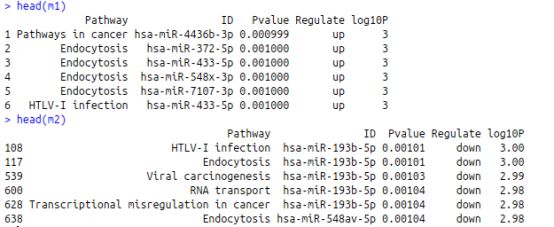
最终数据整成这个样子:
接下来敲重点啦~~
#开始绘图:
library(ggplot2)
library(ggnewscale)
#先做up部分
ggplot()+geom_tile(data=m1,mapping=aes(ID,Pathway,fill?=?log10P),colour?=?“white”)+scale_fill_gradientn(colours?=?c(“white”,“red”))+
#这个是重点,new_scale函数来自ggnewscale包
new_scale(“fill”)+
#再做down部分
geom_tile(data=m2,mapping=aes(ID,Pathway,fill?=?log10P),colour?=“white”)+scale_fill_gradientn(colours?=?c(“white”,“blue”))+
#down的图例翻转一下
guides(fill=guide_colorbar(reverse=T))+
#两个图例排排站
theme(legend.direction=“vertical”,legend.box=“horizontal”,legend.title=element_blank(),axis.text?=?element_blank(),axis.ticks?=?element_blank())+
#还有坐标轴的线
+theme(axis.line?=?element_line(colour?=?“black”))?
#横纵坐标和图标题设置
labs(x?=?“Noncoding?RNA?ID”,?y?=?“KEGG?pathway/GO?Term”,?title?=?“Good?Luck”?)+
#图标题居中
theme(plot.title?=?element_text(hjust?=?0.5)?)
#野人版图片
【小编技巧总结】
- Hadley Wickham是R界的男神没错了
- ggnewscale中的new_scale函数发挥重大作用






 京公网安备 11011302003368号